How to Make an Infographic: A Step-by-Step Guide
What are Infographics?
Infographics! They’re a visual delight, artfully simplifying intricate data. Drowning in information? Infographics are your lifeline. For marketers, educators, or knowledge enthusiasts, they transform chaos into clarity. Got a complex topic? Use an infographic. Why merely tell, when you can dazzle?
We’ll walk you through creating an infographic in this blog article, from selecting a subject to sharing and publishing your finished product.
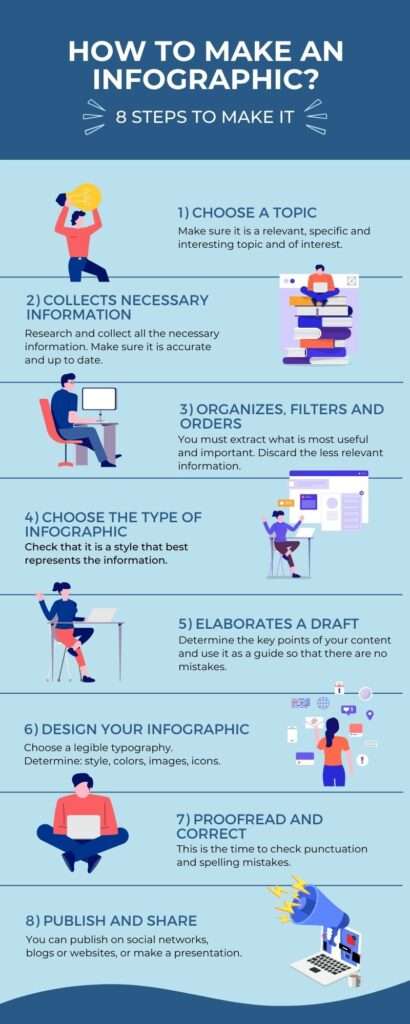
1. CHOOSE A TOPIC
To craft an infographic, first select a topic aligned with your aims and audience. Ponder the message you aim to convey and pick a theme apt for visual depiction, be it through facts, stats, or processes.
2. COLLECT NECESSARY INFORMATION
After pinpointing your topic, amass the essential details for your infographic. This might entail digging into research, amassing data, or sourcing content from credible outlets. Always double-check the truthfulness of your gathered data before moving ahead.
3. ORGANIZES, FILTERS & ORDERS
Put your information in a logical, coherent order now that you have it. Choose the main ideas you want to emphasize and think carefully about how to organize your information. Remove any content that is superfluous or redundant, then organize the remaining information such that it flows naturally for your audience.
4. CHOOSE THE TYPE OF INFORGRAPHICS
Infographics come in a variety of forms, each best suited to a certain type of data and message. Statistics infographics, comparison infographics, timeline infographics, process infographics, and geography infographics are a few examples of common forms. Choose the type that best increases the visual impact of your material and goes with it.
5. ELEBORATE A DRAFT
Make an infographic draught or outline before beginning the design phase. Plan the overall framework, position the text and graphics, and sketch out the layout. This will enable you to see the finished result in your mind’s eye and make any necessary modifications before devoting time to the design process.
6. DESIGN YOUR INFORGRAPHIC
It’s time to finish your infographic now that you have a draught. Select a design program that meets your demands, such as Piktochart, Canva, or Adobe Illustrator. Include features that are pleasing to the eye, such as pictures, charts, and graphs. Use pictures, colors, and fonts that support your brand or message, and make sure the design improves the infographic’s overall readability and aesthetic appeal.
7. PROOFREAD AND CORRECT
After creating your infographic, spend some time editing it to remove any mistakes or inconsistencies. Verify that the visual components are clear and visually appealing, that the data and information are accurate, and that there are no spelling or language errors. Before completing your infographic, get input from friends or coworkers to get alternative viewpoints.
8. PUBLISH AND SHARE
It’s time to publish and distribute your infographic after making any necessary adjustments. Choose the ideal sharing platform, such as your website, blog, social media accounts, or email newsletters. Consider aspects like file size, resolution, and device compatibility as you prepare your infographic for online viewing. To increase its visibility and impact, don’t forget to include a compelling title, a succinct description, and relevant keywords.
CONCLUSION: Infographics are an effective method for conveying complex information in a way that is appealing to the eye. These detailed instructions will help you make infographics that are appealing and successfully communicate your point. Always remember to select a topic, obtain reliable data, organize it well, choose the right infographic type, design clearly and creatively, proofread meticulously, and share your creation with the world. Create your own infographics right away to enthrall your audience with compelling storytelling through visuals.


Pingback: How to increase Traffic on Website or Blog - TIPS 360